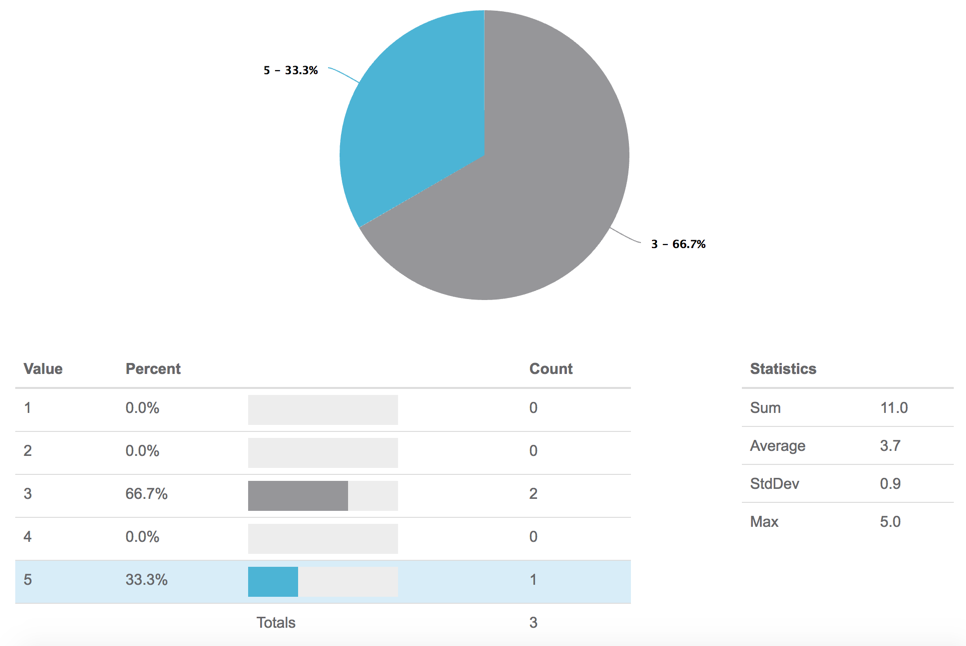
Creating a Profile Report allows you to compare one response to how the rest of the survey sample answered.
For example, if you were conducting a quiz for your students, you could run a Profile Report for each response and hand out the individual report to each student. This would allow them to see how they did compared to the other students.
Setup
- Go to Results > Reports then select Profile from the Create a Report button.
- Select from the available Display Options for the report. You can elect to:
- Include Open Text - this includes data input via open-ended questions such as Textboxes, Essays, etc.
- Include "Other - Write In" Text - this includes text submitted via other, write in textboxes associated with Radio Button and Checkbox questions.
- Include Comments - this includes text submitted via Comment fields added to compatible questions
- Include Location Data - this includes location data collected along with the response.

- Select your Profile Labels (this will default to the first question on your survey). In this particular survey, we asked the respondent what their Name was. This will be how we label each individual profile. Up to two Profile Labels can be added, though only one is required.

- Finally, if your survey includes Custom Table questions, determine whether you want the data grouped by row or grouped by column. Learn more about these grouping options here.
- You'll now see a list of all Profile reports, one for each response, with the options to Preview, Share Report, or to Download the report as a PDF.

- Go ahead and click Preview next to one of your responses, this will give you a first look at the individual Profile Report for that response. It should look like a Summary Report with the answer options for your selected response highlighted.

- Click Customize Report to select which questions will appear in the Profile Report. To remove a question from the report, click on the x icon corresponding to that option. The customization options also allow you to:
- change individual chart elements
- include/remove statistics for compatible elements
- filter report data
Visit the Legacy Summary Report documentation to learn more about customization options.
Incompatible Question Types
All questions are compatible, with the exception of those listed below:
- Textbox Grid*
- Star Ranking Grid*
- Net Promoter Score®*
- Slider*
- Slider List*
- Continuous Sum*
- Grouping (Open Card Sort)
- Image Heatmap
- Text Highlighter
- Video/Audio Sentiment
- Conjoint Choice-Based
*These questions are listed as incompatible with Profile Reports because they report an aggregate statistic for all responses. These questions are included in Profile Reports, but do not highlight the specific respondent's answer.
Net Promoter®, NPS®, NPS Prism®, and the NPS-related emoticons are registered trademarks of Bain & Company, Inc., Satmetrix Systems, Inc., and Fred Reichheld. Net Promoter Score℠ and Net Promoter System℠ are service marks of Bain & Company, Inc., Satmetrix Systems, Inc., and Fred Reichheld.


