In Standard Reports the rows of both Radio Button Grid and Checkbox Grid questions can be reported on separately as either a pie chart or a bar chart. Here are the steps to set this up:
- Click the Insert button between any two report elements and select Question Chart from the dropdown menu.
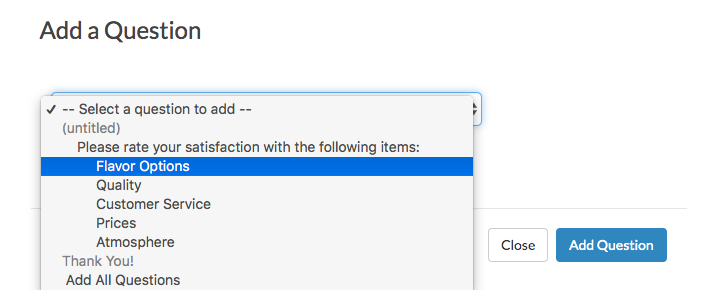
- In the next dropdown menu look for your grid question. Instead of selecting the overall question title select the first row of the grid, seen below, and click Add Question.

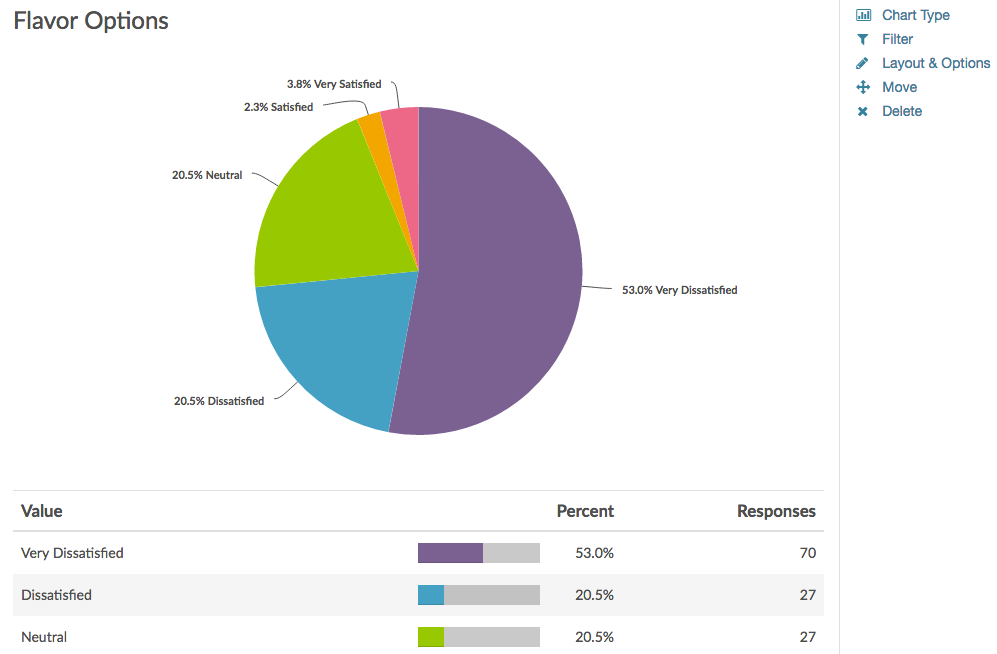
- Continue adding each row of the grid question. This will display the rows of the table in chart format. Beautiful!
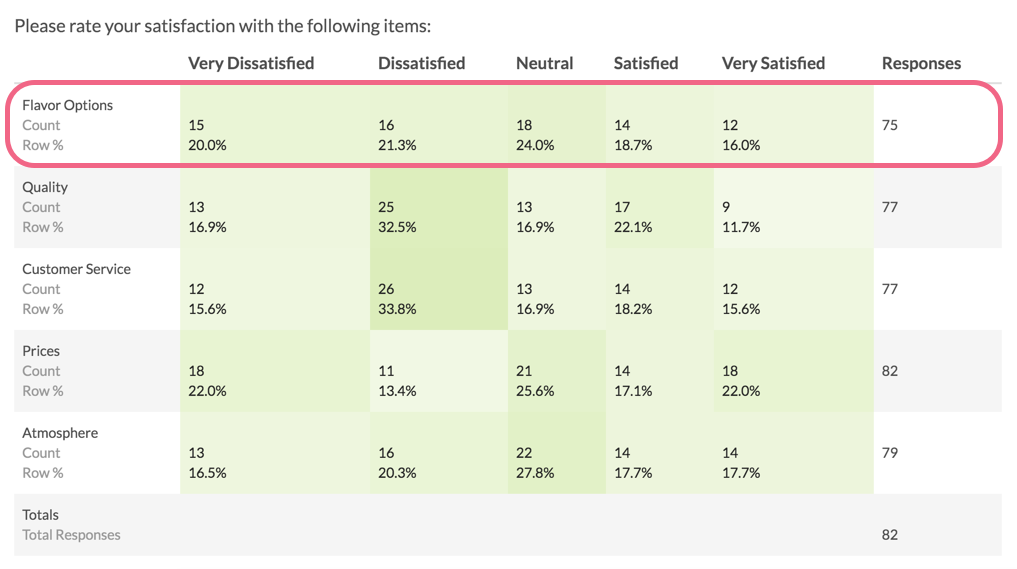
Default Grid Element:

Individual Grid Row as a Pie Chart:

