Add Tag to Responses for Categorization
Response Tags are available to use as a survey administration tool. Use these Response tags to categorize your responses, not for Open Text Analysis. To access your survey responses, navigate to Results > Individual Responses.
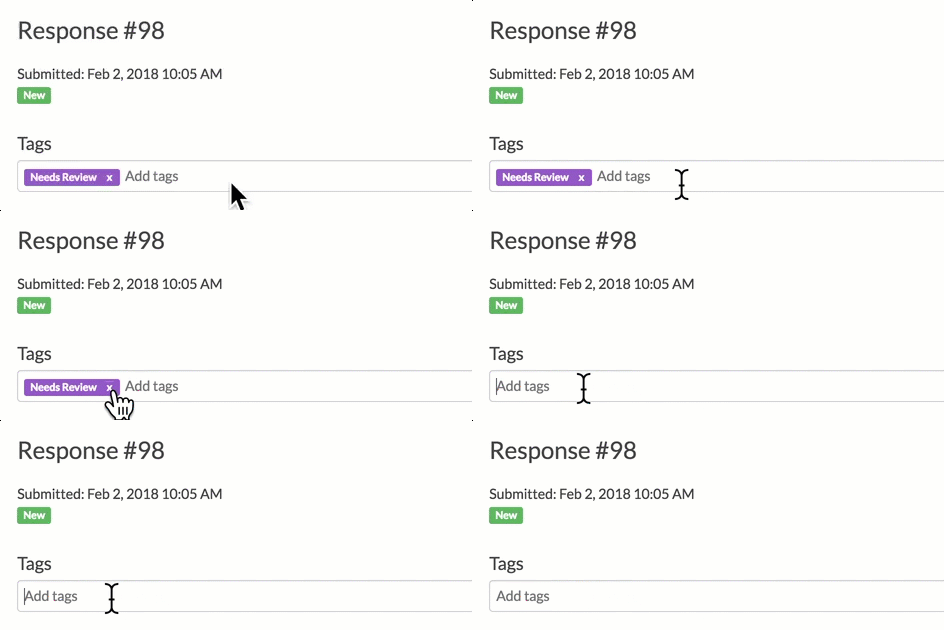
- To add a tag, click on one of your responses and click the Add Tag to Response link in the top right of the Data tab.

- Type the text of your desired tag into the Tags field and click Enter to insert the tag. You can add multiple tags in this manner.

- To remove a tag, click the x associated with the tag.
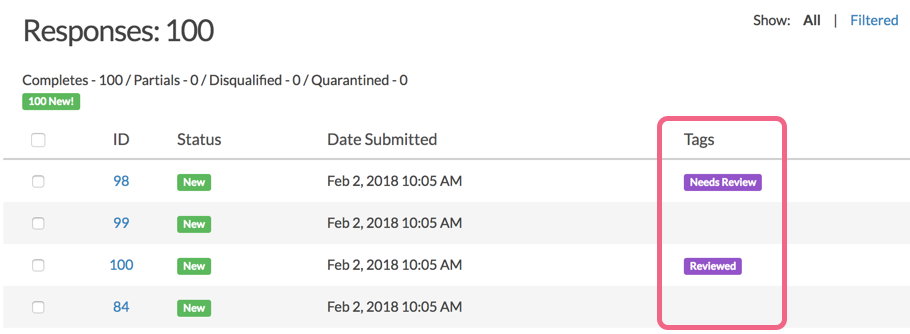
You can display Response tags as part of your Response grid if you wish. Check out our Customize Response Grid Tutorial to learn how!
Response Tags are also included in CSV/Excel Exports. You will see a column labeled Tags - tags will be comma-separated (if more than one tag is added to any given response).
Note: Response tagging is not supported in encrypted responses.
Add a Tag to Open Text Answers
When collecting open text data, you can use tags in the response view to categorize those responses for further analysis in our Open Text Analysis tool. Once you've tagged your answers, you can report on them using pie or bar charts that highlight the trends you've discovered. This feature is useful as you're taking a first look at your collected responses, deleting bad ones, and getting an overall sense of what people are saying.
- To tag a response, go to the Response tab and click on a response. You will see the option to Add Tag to Answer under each open text field.
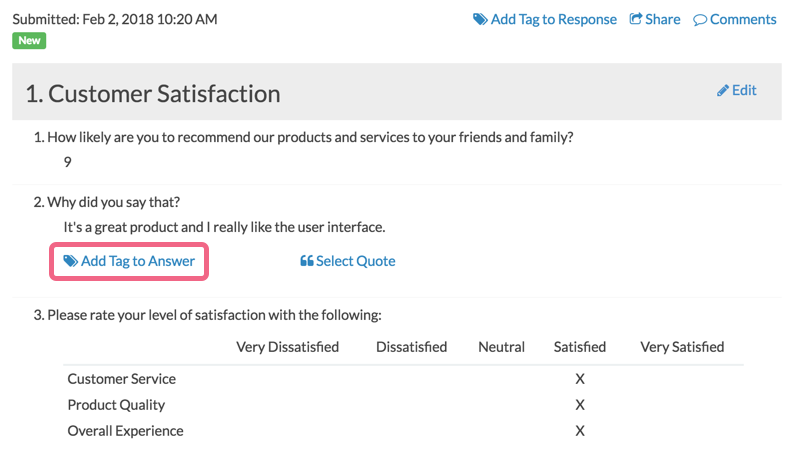
- Press Enter after you're done typing a tag and continue adding as many tags as you need. In the case of the above answer, since it mentions the user interface, we have tagged it as 'UI.'
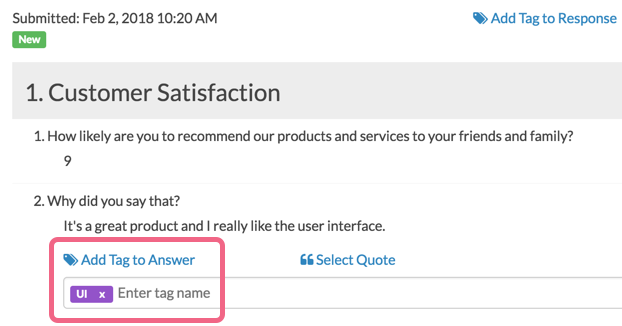
- Navigate to the next response by using the Newer/Older buttons and continue to tag. Recently used tags will appear below the tag field and you can click them to automatically add them to that response. We see 'UI' since it has already been used in this case.
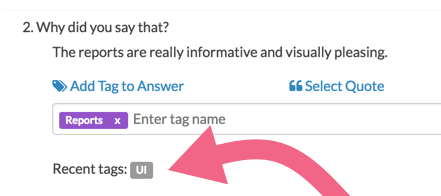
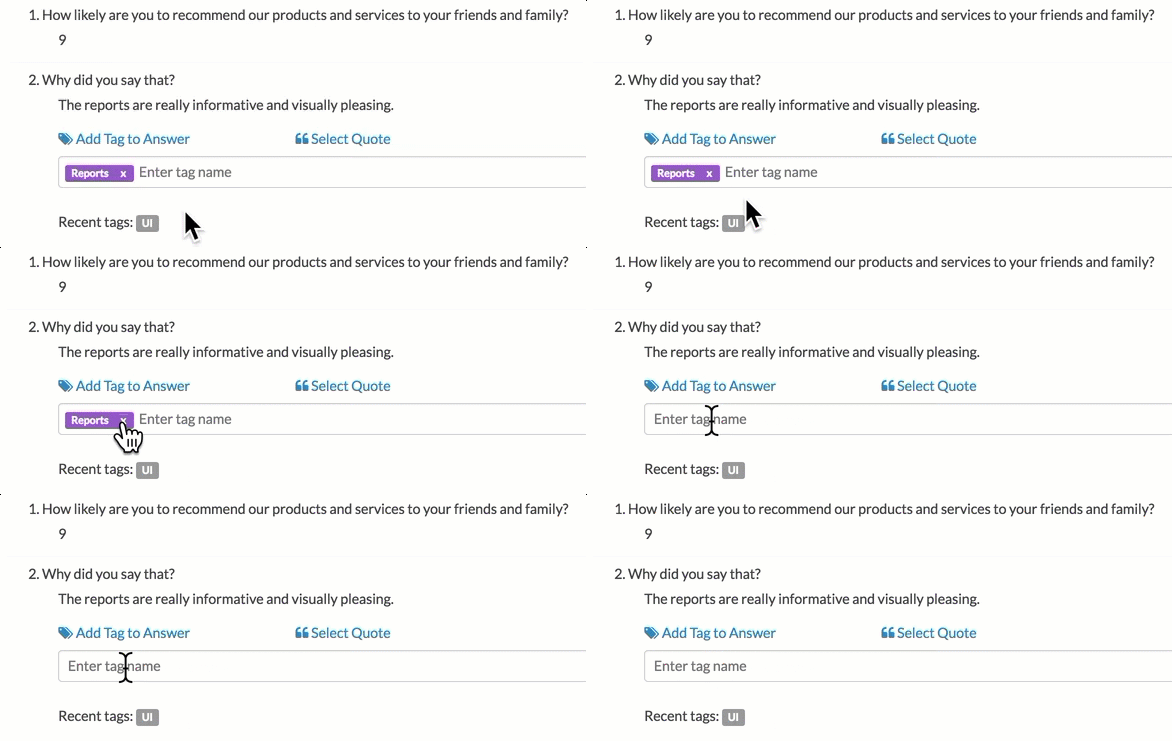
- To remove a tag from an open-ended answer, click on the x associated with the tag.
Once you're done tagging your answers, you can move over to the Open Text Analysis tool and get moving on generating your charts!


