Standard Report: Response Counts
A Response Metrics chart will be included in all Standard Reports by default. This chart includes a completion rate percentage, as well as complete, partial and disqualified response counts. If you wish to remove this chart simply click the x icon to delete it.
Learn more about how Alchemer determines response status.
Longitudinal Chart Options
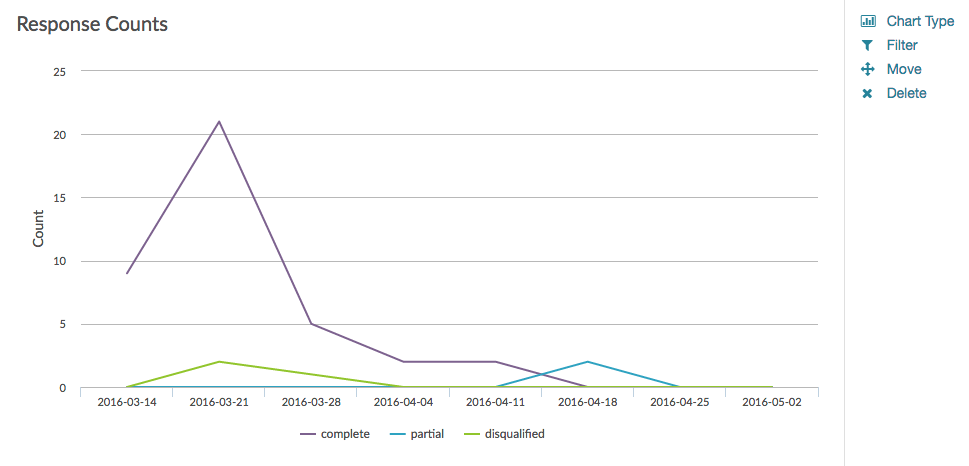
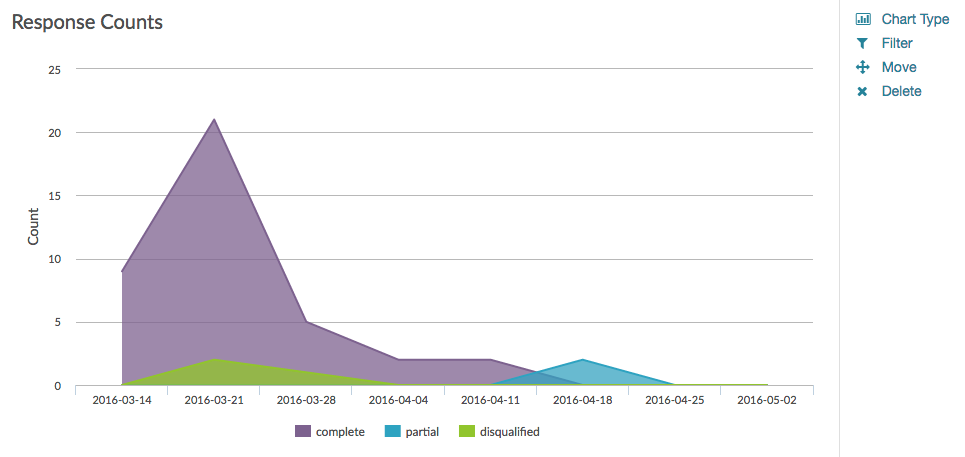
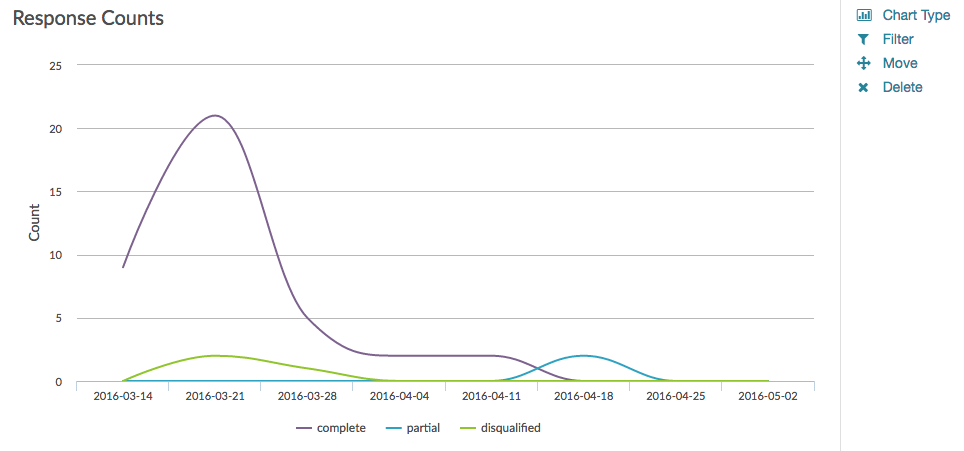
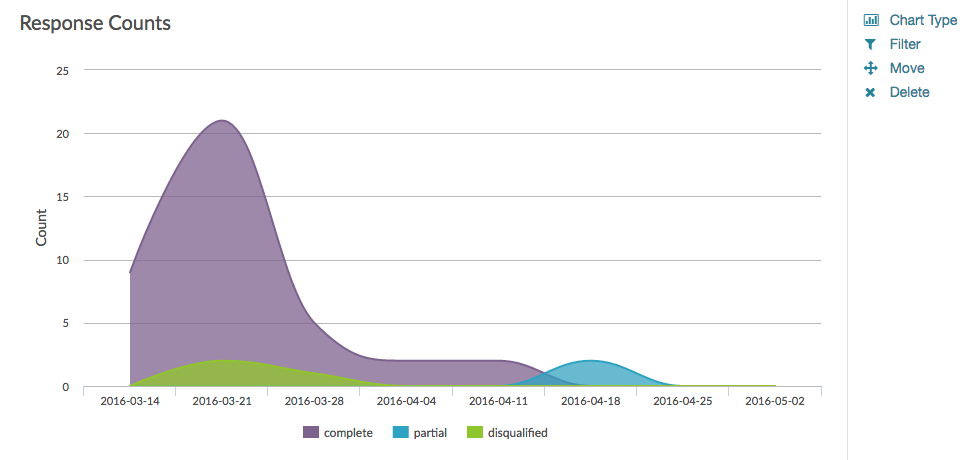
You can change this chart to report on your response data longitudinally by clicking the Chart Type option to the right of the Response Count element . In the Chart Type dropdown menu, select one of the below longitudinal chart types. Customize your Longitudinal Range if you wish.
Line

Area

Spline

Area Spline
