- Check it out in an example survey!
- Add a survey with this question to your account!
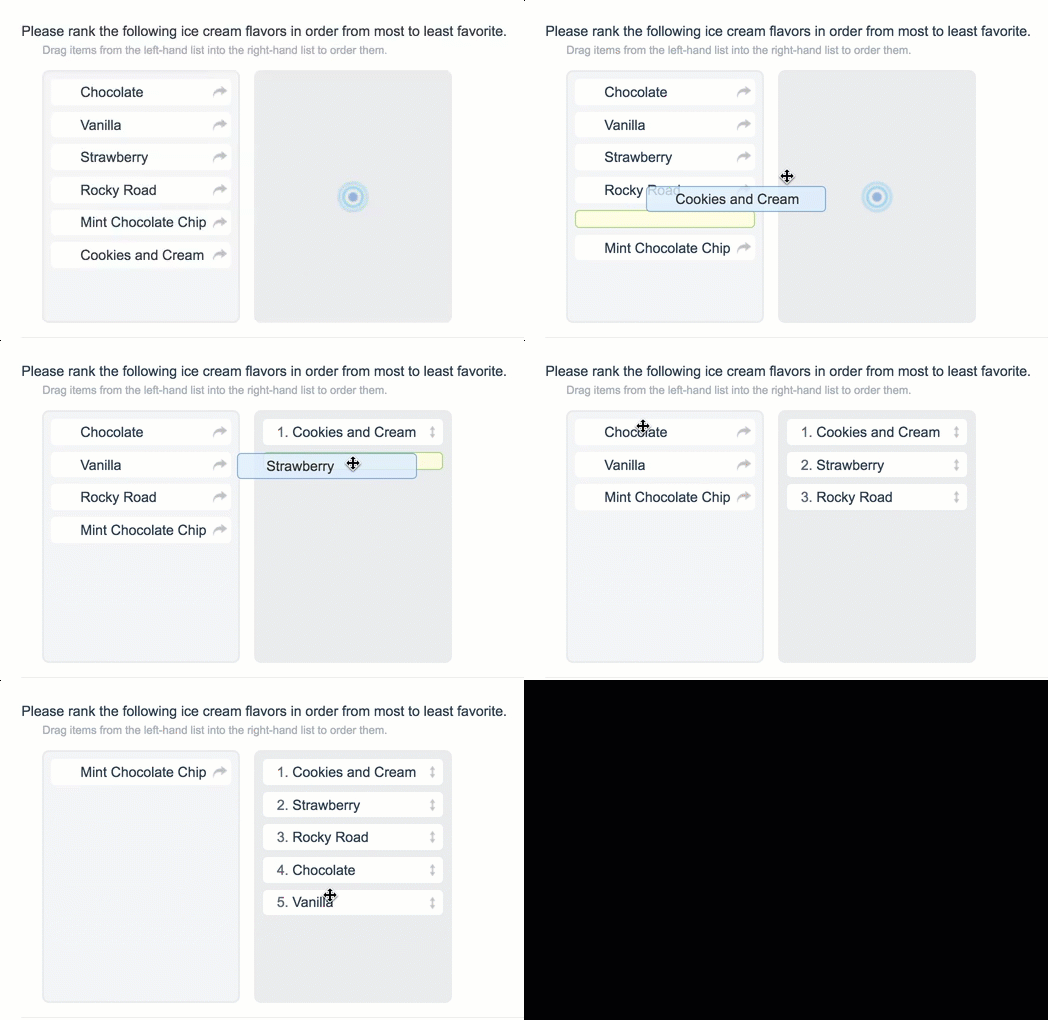
Drag & Drop Ranking questions allow respondents to rank a list of items by dragging and dropping each item in order of preference.
Looking to use images in your Drag & Drop Ranking Question? Check out our Use Images in Drag & Drop Ranking Tutorial to learn how!
While we provide screen reader messages for this question, it is not easily accessible for respondents using screen readers.
Use the standard ranking question as an alternate accessible version. See Ranking Grid Question Type for more information.
When To Use It
Use Drag & Drop Ranking questions as an interactive way to ask your respondents to rank order a list of items first to last.
Compatibility
- This question is not compatible with IE 8 and below. Use the Ranking Grid question as an alternate accessible version.
- While we provide screen reader messages for this question, it is not easily accessible for respondents using screen readers. Use the Ranking Grid question as an alternate accessible version.
Limiting Items to be Ranked
Drag and Drop Ranking questions are designed to rank all items from the left-hand column into the right. This means that your results will rank each item (row) from highest to lowest.
If you'd prefer to gather the top 3 ranked items, you can do so by limiting the number of answers your question will accept. To do so:
- Edit your question and click the Validation tab.
- Enter the maximum number of answers you would like to accept in the Limit answers to field.
- Click Save Question.
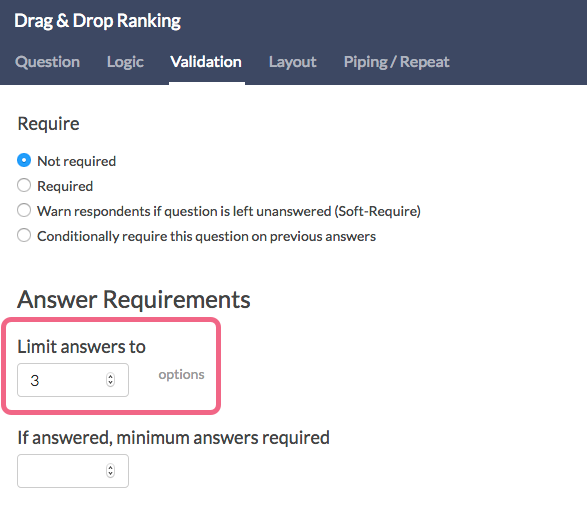
Your question will now only accept the number of answers you indicated. Any additional selections that you drag to the right will not stick.
Customize the Look & Feel
By default the Drag & Drop question takes up about two-thirds of the page and is left-aligned. However, you can customize the layout.
Learn how to use images instead of text as the answer options.
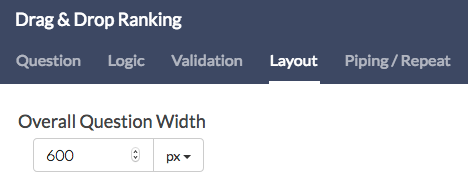
To adjust the overall width
Edit the question and go to the Layout tab. In the Overall Question Width field, enter the pixel width you desire. In most themes, the default width is 410 px. If you are looking to increase the width, enter a higher value for overall question width. If you are looking to decrease the width, enter a lower value for overall question width.
Centering the Drag & Drop Ranking Question
If you are looking to center the entire Drag & Drop Ranking question, you can paste the below CSS in your survey theme. To do so go to the Style tab and scroll to the bottom of the survey preview to access the link to the HTML/CSS Editor. Paste the below CSS code on the Custom CSS tab.
.sg-rank-dragdrop{
margin: auto;
}
Survey Taking
On a desktop and most laptops, the Drag & Drop Ranking question type looks like so.

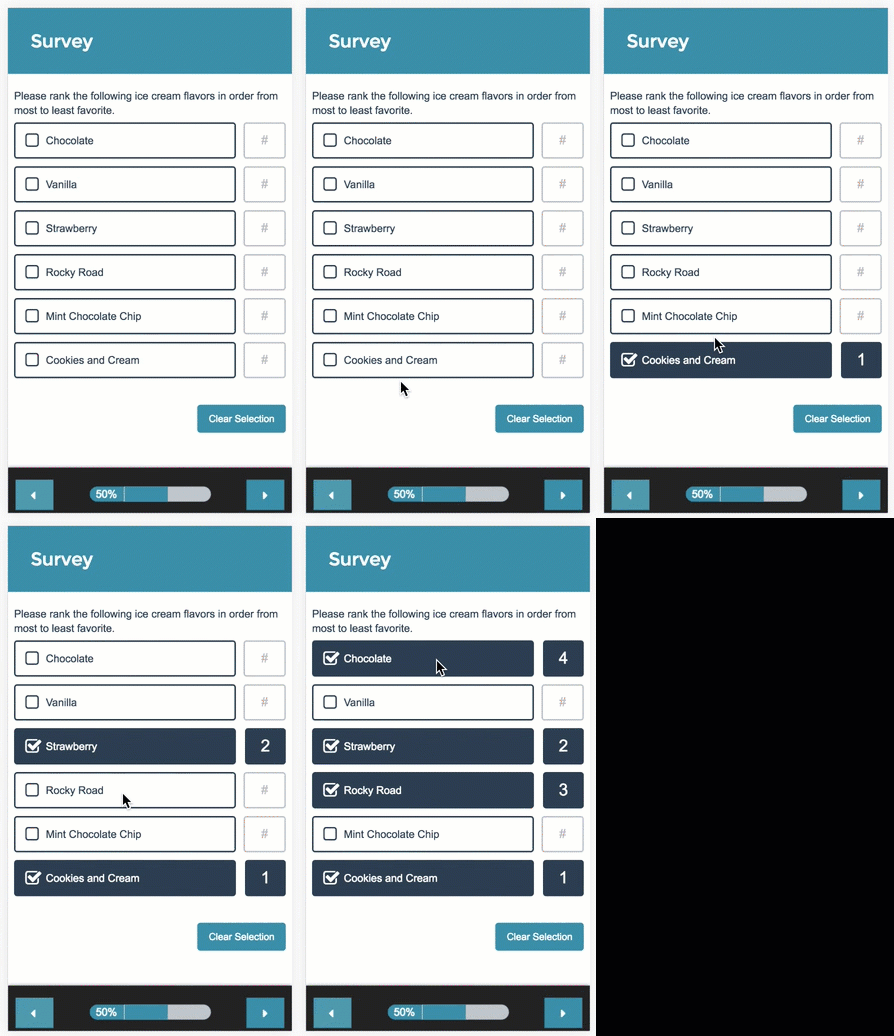
When optimized for mobile devices the Drag & Drop Ranking question type works a little differently as dragging and dropping on mobile devices is difficult. Instead, respondents will need to click the options in order of their preference.
By default, survey questions show one at a time on mobile devices to prevent the need for scrolling on smaller screens. You can turn off this one-at-a-time interaction if you wish.
Reporting
Standard Report
In the Standard Report Drag & Drop Ranking questions report as a Diverging Stacked Bar Chart.

The table will include a row for each item in your Drag & Drop Ranking question. Each item will have a Rank, Distribution, Score, and No. of Rankings.
- The Rank is assigned by the Score.*
- The Score is computed as described below.
- The No. of Rankings is the number of respondents that ranked that item. This can vary if the question is unrequired or you are limiting the number of items to be ranked.
- Finally, the Distribution is a diverging stacked bar where a shade is assigned to each possible rank (which usually corresponds to the number of items unless you are limiting the number of items to be ranked). At the midpoint, the color of the sections of the bar changes to help you to see where preference starts to fall off for each item. The width of each section is determined by the number of times that option assigned that rank.
*If the scores for multiple items are identical the Rank will be determined based on when the option was added to the question. Items added earlier will be ranked higher in the list.
See additional compatible chart types
Within the Standard Report there are various chart types available for visualizing your data. The below grid shows which of the chart types Drag & Drop Ranking questions are compatible with.
See what other report types are compatible
The below grid shows which of the report types Drag & Drop Ranking questions are compatible with. If you plan to do some specific analysis within Alchemer this report compatibility chart should help you choose the right question types!
| Report Type | Compatible |
|---|---|
| Standard | |
| Legacy Summary | |
| TURF | |
| Profile | |
| Crosstab | |
| Comparison |
Computing the Score
The score is a weighted calculation. Items ranked first are given a higher value or "weight." The score, computed for each answer option/row header, is the sum of all the weighted values. The weighted values are determined by the number of columns, which is usually the same as the number of rows but can be less if using the option to Limit Ranked Items.
For example, in the report above, because there are 6 options, the weighted sum for an option that was placed in the first position (1) would be worth 6. The table below shows the formula for computing the total rank for each answer option/row header:
| Total Responses | x | Weight | = | |
|---|---|---|---|---|
| Rank 1 Count | x | 6 | = | |
| Rank 2 Count | x | 5 | = | |
| Rank 3 Count | x | 4 | = | |
| Rank 4 Count | x | 3 | = | |
| Rank 5 Count | x | 2 | = | |
| Rank 6 Count | x | 1 | = | |
| + | Total Score (Answer Option X) |
If you had 7 instead of 6 answer options, then answer options chosen as Rank of 1 would be given a weighted value of 7 points, Rank 2 would be weighted 6 points, and so on and so forth.
When items are not ranked e.g. there are 4 items, but only 2 are ranked OR if you are limiting the number of items to be ranked, the unranked items are given a score of 0 and the first-ranked item is only given a score of 2 and second-ranked is given a score of 1.
Exporting
If you'd prefer to look at your ranking data at a more individual level or unsummarized format you can do so by exporting your data.
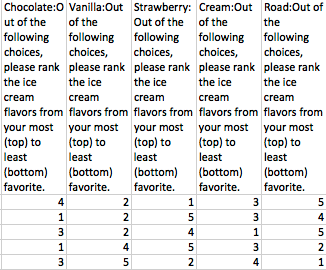
In CSV/Excel exports, each rank item will export as its own column. The column headers will first display the rank item and then the question title. Users can see the actual rank selected for each of the answer options in your ranking question in the row. For each response (the row), the value in the cell for that column or answer option repesents the rank selected by the respondent during survey taking.
A Note About Piped and Unrequired Drag & Drop Ranking Questions
Drag & Drop Ranking questions use a weighted score that is based on the number of answer options. Because the number of options that are ranked can vary in option-piped or unrequired questions, this can result in skewed data.
If you wish to pipe into a Drag & Drop Ranking question or leave the question unrequired, we recommend setting the minimum and max selectable options equal to each other in your source question. This way, each response has the same number of options and the weighted score is computed correctly.
Net Promoter®, NPS®, NPS Prism®, and the NPS-related emoticons are registered trademarks of Bain & Company, Inc., Satmetrix Systems, Inc., and Fred Reichheld. Net Promoter Score℠ and Net Promoter System℠ are service marks of Bain & Company, Inc., Satmetrix Systems, Inc., and Fred Reichheld.


